What a Fast Site Really Means
Every web design company promises that your site will be loading fast. Almost no one explains what this means and how to check it. Core Web Vitals is the answer: three specific indicators by which Google evaluates how a page feels to a living person. They are open, checked for free, and after understanding them once, you can evaluate any site — including the portfolio of those who are selling to you now, and including ours — in about two minutes.
Three numbers without jargon
Google measures three things. Each has a frightening abbreviation and a simple meaning.
LCP — how long to wait until the largest visible element appears. Largest Contentful Paint measures the time from the click on the link to the moment when the largest element of the page is visible: usually the title or the main image. Up to 2.5 seconds is good. More than 4 is a failure. It is this number that coincides with your internal feeling that the site is slow.
INP — how quickly the page responds to the action. Interaction to Next Paint measures the delay between clicking a button or menu and the visible response of the page. Up to 200 milliseconds is good. If you've ever poked around in the menu on your phone and didn't understand whether the tap was counted or not, that's a bad INP.
CLS — how much the page jumps around while loading. Cumulative Layout Shift measures visual stability. A familiar situation: you aim at a link, a banner is loaded from above, everything slides down — and you end up in the wrong place. This is a layout shift. Less than 0.1 is good. And, unlike the first two, it's not about speed at all: it's about the page not traveling under your finger.
That's the whole system. Appear quickly, respond quickly, stand still.
Why exactly these three
Because they describe how a page is experienced by a living person, and not how the server looks on paper. The site can be on a powerful server and still be annoying: the page appeared, jerked, ignored the first click. For years, Google has observed how people leave pages, and reduced it to three reasons: nothing appears, nothing responds, everything shifts. Vitals measure exactly these three irritants.
Plus they affect positions. Google has confirmed that page usability is a ranking factor. A fast site will not save empty content, but between two comparable pages, the one that passes the test usually wins. If you pay for advertising, the effect is compounded: fast landing pages get the best quality indicator, which means that the click costs less.
How to check any site in two minutes
Open PageSpeed Insights — pagespeed.web.dev — and paste the address. It's Google's own tool, and it's free.

SCREENSHOT 1 — Page Speed Insights
Click "Analyze" and you will see two blocks, and the difference between them is more important than most web development contractors will tell you.
Let's analyze the report: what are you actually looking at?
Further, step by step, because the report scares people so much that they ignore it. This is what the vague promises of unscrupulous contractors are based on.
Step 1. Look at the tabs on top — "Mobile" and "Desktop". The tool opens on the mobile tab, and it is the main one. Most of your visitors are sitting on their phones, with worse connections and weaker hardware. A site with a score of 98 on desktop and 46 on mobile is a slow site. Anyone showing you only the desktop number is showing you the flattering half.
Step 2. Find the top block — "What real users see." This is field data: real measurements from live Chrome users over the last 28 days. Green, yellow and red bars for each of LCP, INP and CLS. This is the truth. This is exactly what Google uses when ranking.
If this block is not there at all, you will see a note that there is not enough real data. This is not a failure — it's just that the site does not have enough traffic for a reliable sample. New sites and small businesses often have no field data at all. And this is where everything goes wrong.
Step 3. The big number you're looking at is NOT field data. Below is the "Diagnose performance issues" block, and this is the Lighthouse lab test — a simulation that Google runs right now on a conventional average phone with a throttled connection. It is this that gives the large coloured number out of 100, the one everyone screenshots.
Laboratory evaluations are useful. They are reproducible, work on new sites without traffic and show exactly what is slowing them down: the diagnostics list every heavy picture and every blocking script. But the laboratory evaluation is a controlled test, not a measurement of real visitors. A site can give out 100 in the laboratory and still annoy people — usually due to the fact that the laboratory does not reproduce: a slow database under real load, advertising scripts that work only with live users, CDN failures in certain regions.
Total: laboratory evaluation tells how well the site is put together. Field data shows how it actually works.
You need both — and you need to understand which one is being shown to you.
Step 4. Go to diagnostics. The "Opportunities" and "Diagnostics" sections list specific problems: uncompressed images, unused JavaScript, blocking resources. You don't have to fix it yourself. You need to be able to tell the developer: "in the report, 2.1 seconds for unused JavaScript — what is this?"
Our own scores
It would be inconsistent to write all this and not point the tool at ourselves.
emicode.ca now scores 100 in Lighthouse — performance, accessibility, best practices and SEO — on both mobile and desktop. Check it yourself, that's the whole point of the article. If the number has slipped by the time you read it, we'd rather you notice it than take our word for it.
And now the disclaimer that you deserve, having read this far: this is a laboratory evaluation. According to our own argument above, it is not equal to field data — and we are a young web development studio, and our site does not yet have enough traffic for Google to collect a reliable sample of real users. We are not going to show a laboratory number and pass it off as proof of something it does not prove.
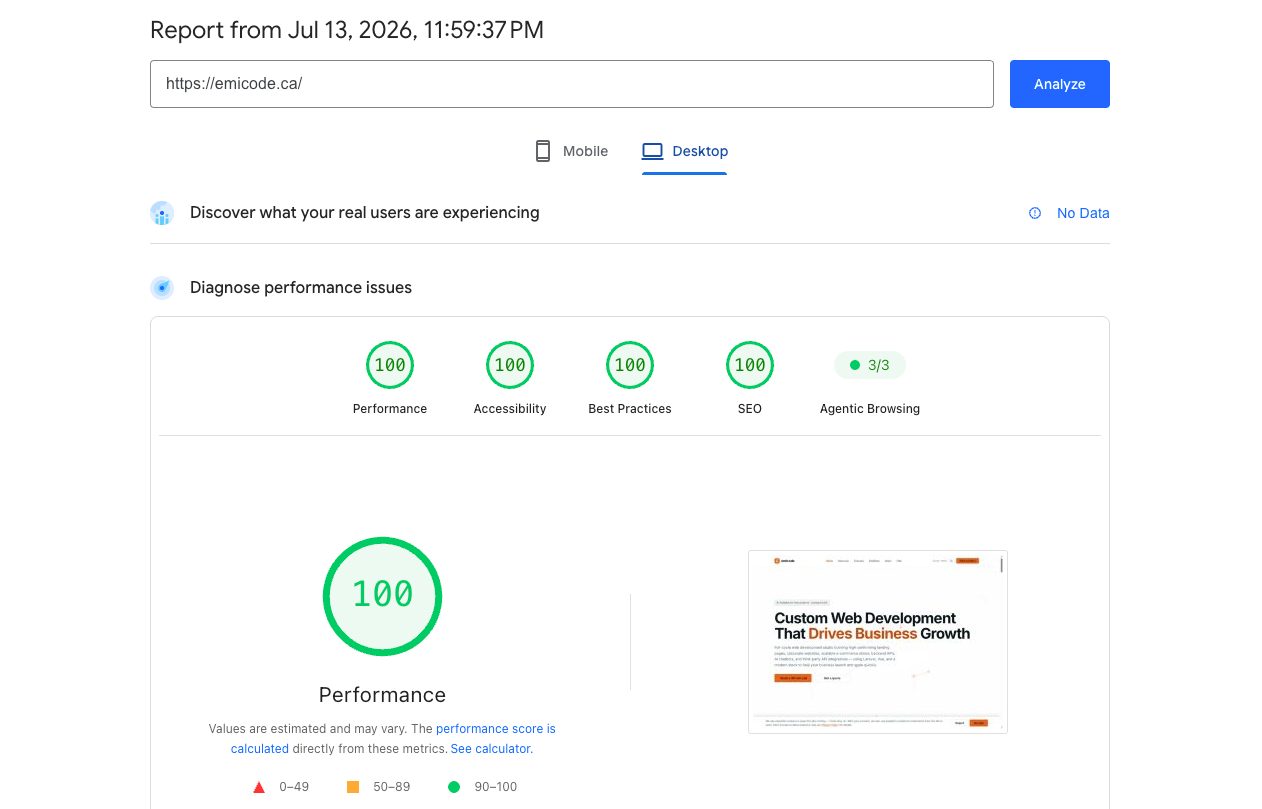
SCREENSHOT 2 — emicode.ca's own scores
And two more honest points. A perfect 100 on a well-built brochure site is genuinely achievable: it's hand-coded, the images are optimised, and there's no plugin stack. A complex online store with live balances and payment scripts is a much more difficult goal, and the one who promises you 100 on such a project either does not understand the task or expects that you will not understand. And a hundred is not a medal, but a basic level. It means that nothing is broken. It does not mean that the site is good.
What the rating really proves is narrower, but still valuable: the site was made by people who measure. This is exactly what you are trying to find out.
What actually slows down sites
The scores come from somewhere. The usual suspects, roughly in order of frequency:
Heavy pictures. A 4 MB photo, compressed into a thumbnail, is still downloaded in its entirety. The most common LCP killer and the cheapest to fix.
Bloating from plugins and page builders. Each plugin, tracker, and page-builder layer adds code that the browser must download and execute before the page starts responding. A site assembled from twenty plugins always loads all twenty plugins. This is the structural reason why template builds fail INP: it's not just one bad plugin, it's the accumulation. It is also the clearest argument for a custom website developer over an assembled one.
Late items without reserved space. Banners, advertisements and widgets that pop up after rendering and give a layout shift. It is treated by reserving a place in advance — an elementary discipline that is regularly forgotten.
Cheap or remote hosting. If the server responds for two seconds, no front-end optimization will save it. Physical location is also important: a site from Frankfurt will always feel slower in Canada than a site from Canada.
Please note that all items have one thing in common: nothing exotic. These are decisions made during assembly. A site is fast or slow mainly because of how it was put together — that's why "optimize later" so often means "never".
What to actually ask about
If you hire a web design company to build or repair a website, don't ask "will it be fast" — the answer is always "yes". Ask otherwise:
- "What are the Core Web Vitals of your latest projects?" Then check for yourself with PageSpeed Insights. Ask for field data if the site has traffic; accept laboratory ones if there is no traffic — but understand the difference.
- "Show a mobile rating, not just a desktop one."
- "How do you maintain speed after launch when content and scripts accumulate?"
A vague answer to a specific question is also an answer. A team that is serious about performance talks about it in numbers because it measures them. Now you can too.
Emicode builds every site to a 90+ performance score in Lighthouse, and we publish our own scores above — so you can check, not believe. If you are now comparing web design firms, our analysis of how to choose a web studio covers the rest of the questions.